
The more we all know, the better we can do!
MVWSD Facts
The district, by the numbers.
Public records about the Mountain View Whisman School District, one question per page. Every figure is taken from a document the district filed with the state, and every chart says which document and which page. Nothing is estimated. If a question cannot be answered from a public record, it is not here.
In the district’s own words · Board meeting, October 22, 2026
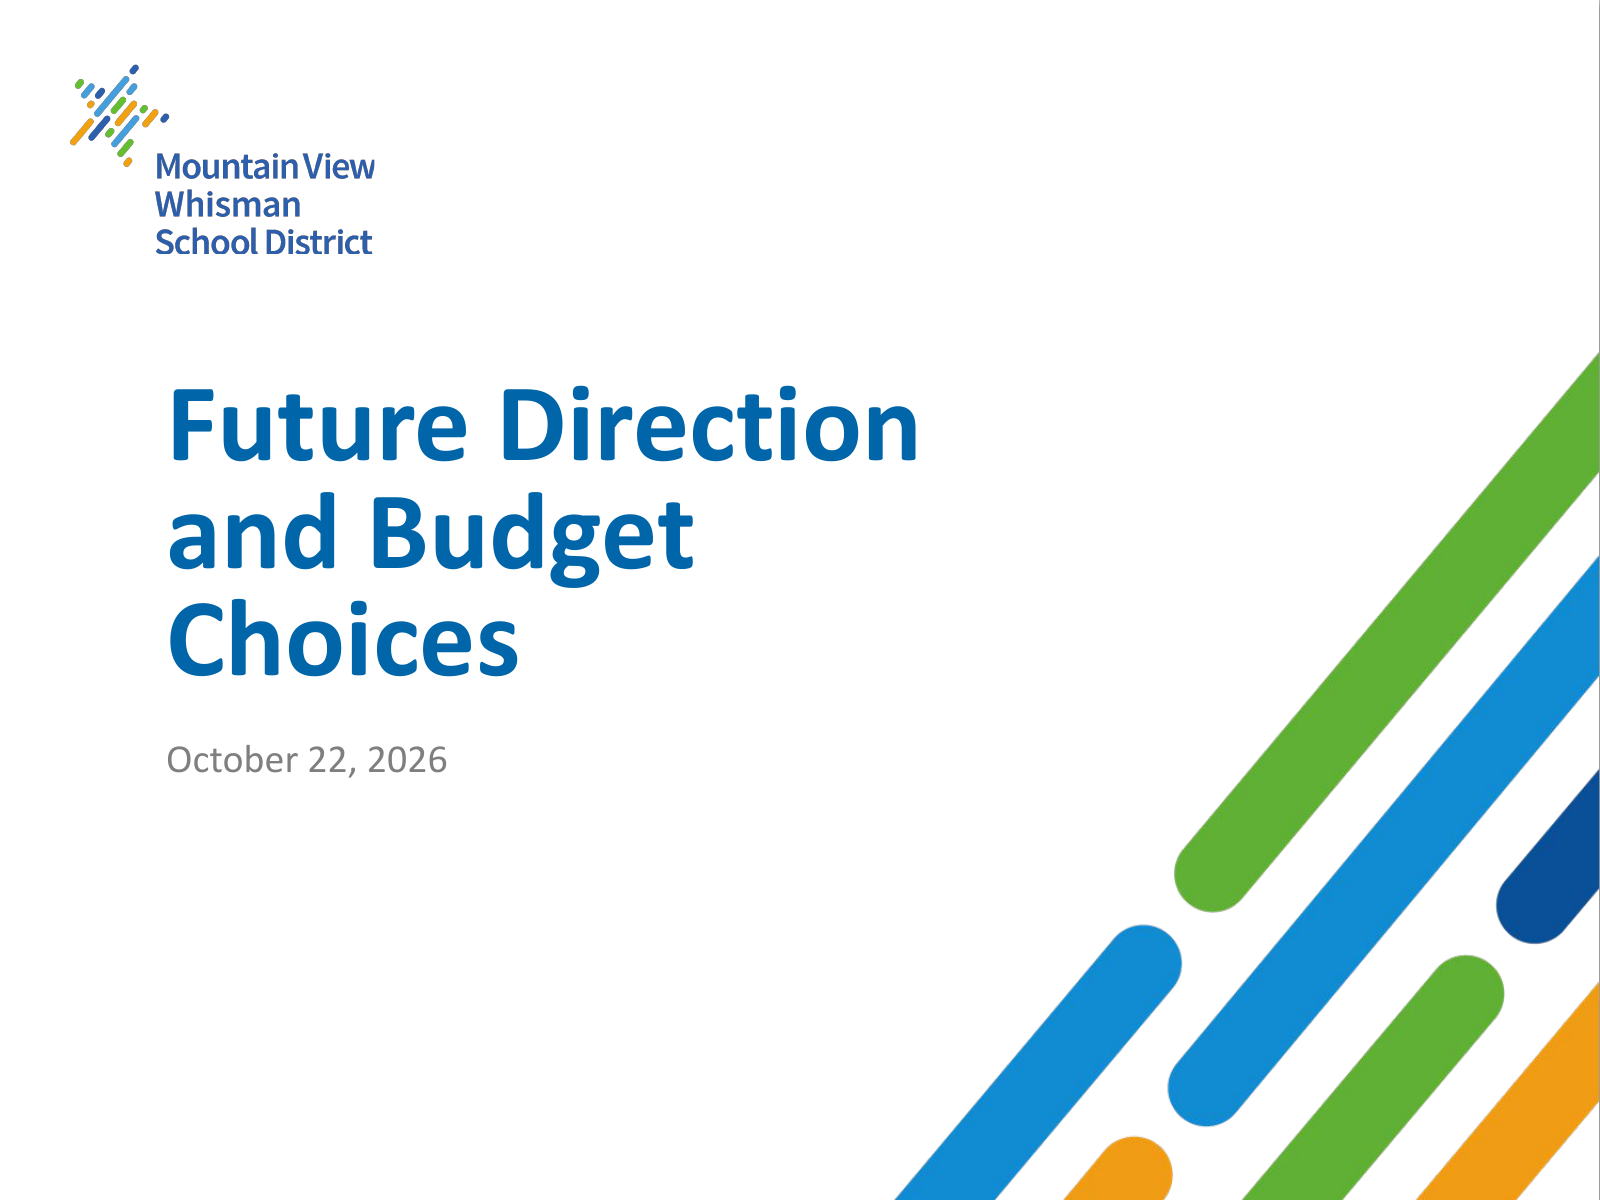
Future Direction and Budget Choices
The superintendent’s and chief business officer’s slides for the October 22 Board of Trustees meeting, page for page as the district published them. Nothing has been edited, cropped or annotated. Source: the district’s PDF on its board agenda system.
Links inside the deck
- Slide 2: Systems Study, 2025
- Slide 23: 8-20-26 Budget Considerations Board Intro
- Slide 23: 2025-2026 Unaudited Actuals
- Slide 23: 9-17-26 Reserve Levels
- Slide 23: 2025-26 Budget Decisions Resources
 1 / 23
Use the arrow keys, swipe, or tap a thumbnail.
Budget
Revenue, spending, reserves and the district's own projections, from its state budget filings.
Where does the district's revenue come from?
Four sources fund the General Fund. Most of it is the state's per-student formula, paid largely from local property taxes.
$122.4M
revenue, 2025-26 budget
How has revenue changed since 2019-20?
Growth by source, adopted budget to adopted budget, and the mix over every year on record.
+62%
total revenue growth, 2019-20 to 2025-26
Where does the money go?
Spending by major category: teacher salaries, classified salaries, benefits, supplies, services and everything else.
$130.0M
spending, 2025-26 budget
How much of spending goes to salaries and benefits?
People are the district's main cost. This tracks salaries plus benefits as a share of all General Fund spending.
80%
of 2025-26 spending is salaries and benefits
What are the biggest line items?
The fifteen largest account lines in the current budget, from teacher salaries down, with each one's share of the total.
$39.7M
largest single line: certificated teachers' salaries
Which spending lines grew the most since 2019-20?
Line items ranked by percentage growth and by dollar growth, plus the lines that shrank.
+67%
total spending growth, 2019-20 to 2025-26
Is the district spending more than it takes in?
Revenue against spending for every year on record, including the district's own year-end estimates and its forward projection.
-$7.6M
revenue minus spending, 2025-26 budget
What does the district project for the next two years?
The multiyear projection filed with each budget, and how each year's forecast compared with the next.
-$16.5M
projected change in fund balance two years out
How much does the district hold in reserve?
The projected ending General Fund balance in each adopted budget, and how it compares with annual spending.
$43.6M
projected ending balance, 2025-26
What does the district spend per student?
General Fund spending and revenue divided by enrollment, for every year with both figures on file.
$27,523
per student, 2025-26 budget
Students
How many students the district serves, and how they do on state tests in reading, math and science against the county and the state, by grade and student group.
How many students does MVWSD serve?
District-wide enrollment as reported to the state, from the 2018-19 peak to the current year.
4,661
students, latest reported count
What did each budget assume about enrollment?
Every budget filing's enrollment assumption against the count later reported, and where filings disagree with each other.
-397
largest miss between a budget's assumption and the reported count
How do MVWSD students score in reading, math and science?
Mean scale scores and the share meeting the standard, grade by grade, against the county and the state, for the latest test year.
63%
MVWSD students meeting or exceeding the ELA standard, 2024-25
How have test scores changed since 2018-19?
Year-by-year results for every tested grade, MVWSD against the county and state, through the pandemic and after.
-5.4 pts
change in MVWSD students meeting the math standard, 2018-19 to 2024-25
How do different student groups perform?
Results by economic status, English-language fluency, race and ethnicity, disability, parent education and gender, with county and state comparisons.
51 pts
ELA gap between students who are and are not socioeconomically disadvantaged, MVWSD 2024-25
Are achievement gaps closing?
Each student group's results in every test year since 2018-19, and how MVWSD's change compares with the state's.
-11.2 pts
change for socioeconomically disadvantaged students meeting the math standard, MVWSD, 2018-19 to 2024-25
Teachers
How MVWSD's teachers are paid, how experienced they are, and how many students each teacher serves, from the district's annual salary report to the state.
How much are MVWSD teachers paid?
The 2024-25 salary schedule with teachers placed on it, the average salary paid, and how both rank statewide and in the county.
$115,063
average salary paid to MVWSD teachers, 2024-25
How experienced are MVWSD's teachers, and what does each band earn?
Teachers grouped by years-of-service step, with the share and average pay in each band against the county and the state.
15%
of MVWSD teacher FTE in their first two salary steps
How many students are there per teacher?
Average daily attendance per teacher FTE on the salary schedule, ranked against every district in the county and the state.
14.9
students per teacher FTE, MVWSD 2024-25
Compensation
What the district pays its leadership and staff, from approved contracts, published salary schedules and public payroll records.
What are the district's top administrators paid?
Cabinet salaries approved by the Board for 2025-26, and every district-office position in the 2024 public payroll.
$385,000
superintendent's contracted annual salary, 2025-26
Where does MVWSD's superintendent pay rank in California and the county?
Percentiles for the superintendent's salary, average principal pay and the teacher salary schedule, from every district's annual report to the state.
97th pct.
superintendent salary among all California school districts, 2024-25
How do MVWSD's management salary schedules compare with nearby districts?
The 2025-26 director, coordinator and executive schedules of MVWSD, Los Altos, Sunnyvale, Cupertino and Palo Alto, side by side.
$274,111
top of MVWSD's certificated director schedule, 2025-26
How does leadership pay compare with nearby districts?
Superintendent and cabinet payroll in MVWSD and four neighbouring districts, from the public payroll record.
$414,555
MVWSD superintendent base pay in the 2024 public payroll
Who is on the district payroll, and what does each group cost?
All 918 records of the 2024 public payroll grouped by job family, with the distribution of pay across the whole workforce.
$85.3M
2024 pay plus benefits, all records
How to read these pages
- Adopted budget figures are what the Board approved each June for the coming year. Estimated actuals are the district’s own year-end estimate for the year just finished, as printed in the following year’s budget.
- Dollar figures are the General Fund (the district’s main operating fund), unrestricted and restricted combined, as reported on the state’s Form 01.
- 7 budget years are covered, 2019-20 through 2025-26, from 7 filings. See sources and method.