Introduction
The California Department of Education released the CAASPP results for the 2025-26 school year yesterday, October 15, 2026. We have been talking about academic achievement throughout this campaign for the MVWSD Board of Trustees, and particularly about the achievement gap.
I downloaded the publicly available data from the Department of Education and analyzed it for grades 3 through 8 (six grade levels) in ELA and math (two subject areas), a total of twelve comparisons. I looked at the five years of data from 2021-22 through 2025-26, and added a pre-pandemic data point, 2018-19, to compare against.
As I have been saying, I did not look at proficiency buckets. I looked at the granular scale scores instead. The one caveat of scale scores is that you can only compare within a grade level, across schools and school districts, and not across grade levels.
Key findings
Let’s dig a little deeper, starting with the good news first.
Above peers overall, everywhere.
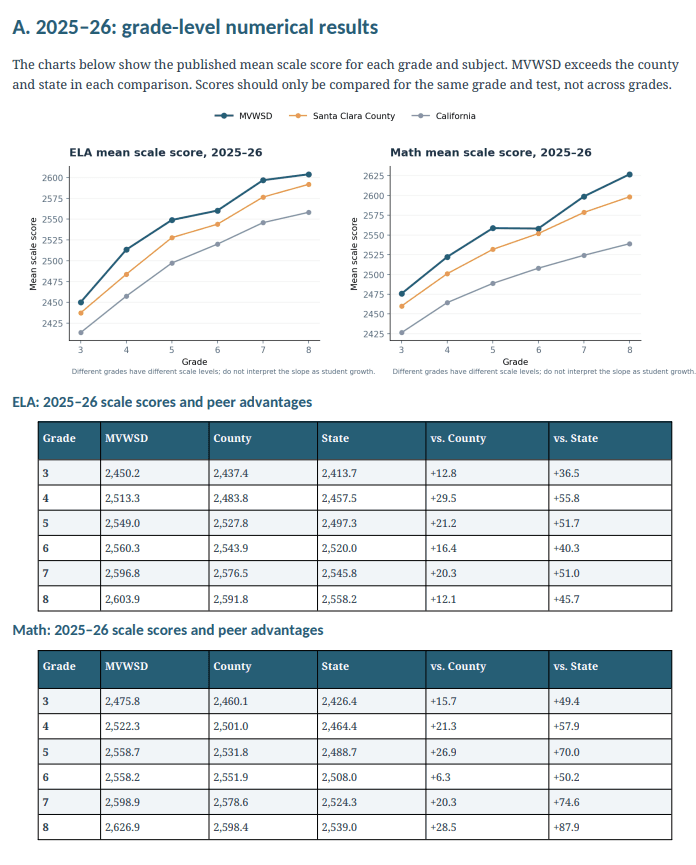
All twelve grade-by-subject MVWSD mean scale scores for 2025-26 exceed both the county and California. The advantage over the county is smallest in Grade 6 math (+6.3 points) and Grade 8 ELA (+12.1 points).
The pre-pandemic recovery is uneven.
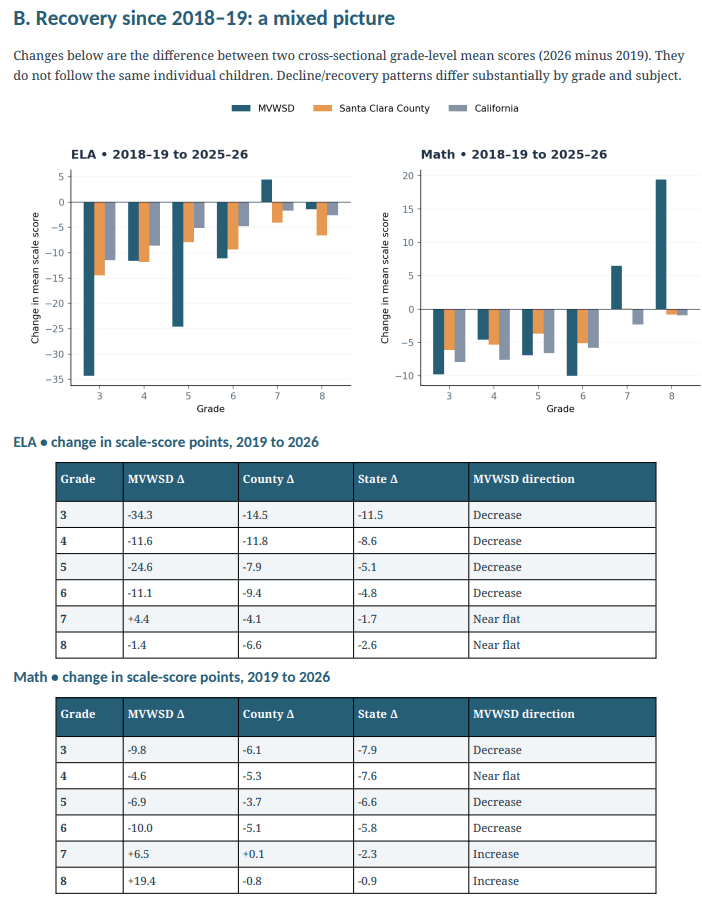
Compared with spring 2019, district ELA mean scores are lower in five of six grades, including Grade 3 (−34.3) and Grade 5 (−24.6); Grade 7 is +4.4. In mathematics, Grades 7 and 8 are above 2019 (+6.5 and +19.4), while Grades 3 through 6 remain below.
Grade 5 is an equity warning.
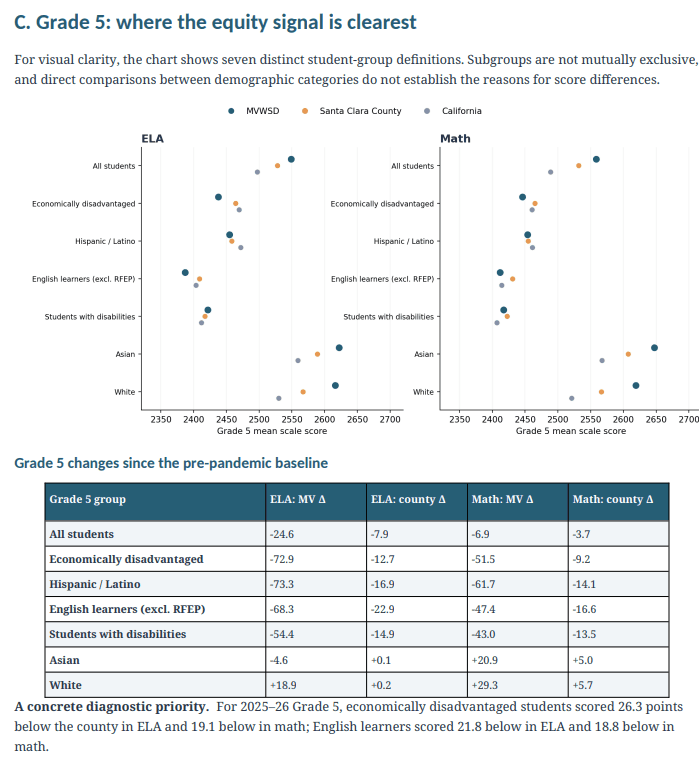
Economically disadvantaged Grade 5 students lost 72.9 ELA and 51.5 math scale-score points between 2019 and 2026. Hispanic/Latino Grade 5 students lost 73.3 ELA and 61.7 math points. The corresponding county declines are much smaller.
The English-learner challenge is broad.
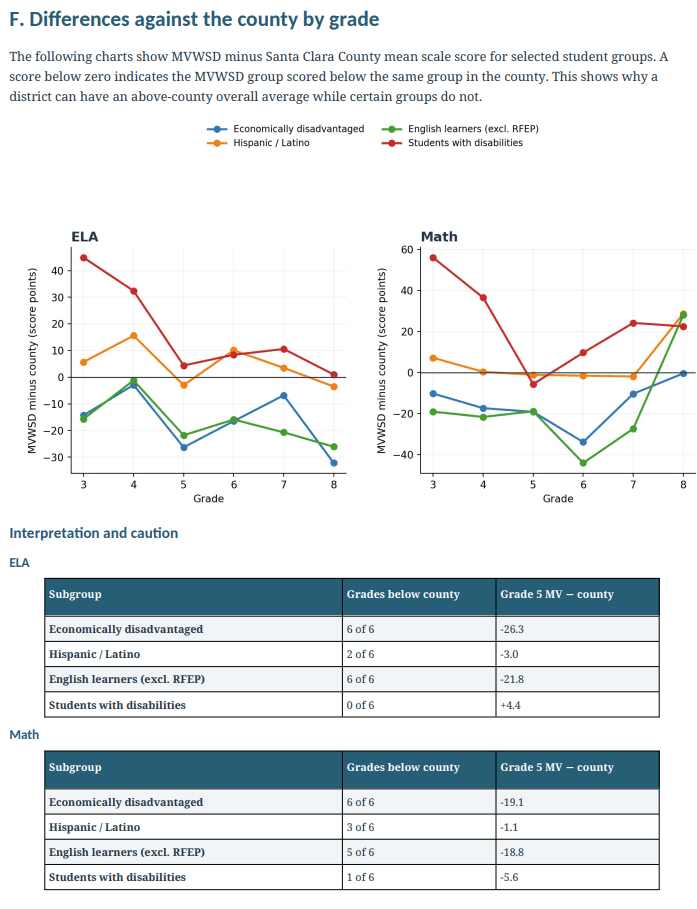
For English learners (excluding reclassified fluent English proficient students), 2025-26 MVWSD ELA means are below the county in all six grades. Grade 5 ELA is 2387.1, below the county score of 2408.9.
Actions I would recommend and push for if I were on the board
The achievement gap is real, growing and, if we are being honest, for a $122M-revenue district it is frankly embarrassing.
First 30 days
Commission a Grade 3 ELA and Grade 5 ELA/math instructional review.
Include standards and strand results, curriculum and intervention schedules, teacher supports, ELD implementation, student attendance and school-by-school disaggregation. Avoid guessing causes from aggregate mean scores.
First 60 days
Publish a grade-by-subgroup public scorecard.
Report mean scale scores, tested counts, grade-specific county and state comparisons, proficiency rates, year-over-year and 2019-baseline changes, and suppressed-data safeguards. Highlight economically disadvantaged, Hispanic/Latino, English learners and students with disabilities.
First 90 days
Set measurable grade-level intervention goals.
Prioritize Grades 3 and 5 ELA and economically disadvantaged and Hispanic/Latino Grade 5 mathematics. Define measurable interim reading, writing and math diagnostics with a clear support pathway.
Within the semester
Audit equitable access to academic supports.
Compare access to intervention blocks, tutoring, language development, effective materials, qualified staffing and family engagement across schools. Use leading indicators such as attendance and participation.
Quarterly thereafter
Review interventions openly and adapt.
Publish what was implemented, for whom, the proportion reached, leading measures and what changed. Examine both score averages and subgroup gaps; preserve student privacy.
Board guardrails
- Interpret this as a diagnostic, not a causal evaluation. Ask for school-, cohort- and classroom-level evidence before attributing a decline to policy decisions.
- Never sum subgroup counts: student-group categories overlap. Suppressed cells must remain suppressed, even if other sources could permit inference.
- Use longitudinal student-level growth measures only in privacy-safe district internal systems. The public CAASPP files cannot identify the same children over time.
- Track both ELA and math, and distinguish recovery from 2019 from progress since 2025.
Sample board scorecard
A transparent recurring format makes it easier to tell whether interventions are reaching the intended students and yielding improvements. It also makes year-to-year conversations less dependent on proficiency cutoffs alone.
| Dimension | Metric | Frequency | Lens | Decision use |
|---|---|---|---|---|
| Academic outcome | Mean scale score by grade, subject, subgroup | Annual | District / school | Direction vs prior year; 2019 baseline |
| Peer benchmark | MVWSD minus county; MVWSD minus California | Annual | District / school | Close negative peer gaps |
| Opportunity gap | Within-grade economic, EL and disability outcome gaps | Annual | District / school | Reduce gaps while lifting all groups |
| Access | Intervention participation and dosage | Quarterly | School / student group | Meaningful coverage of students identified |
| Attendance | Chronic absence and class attendance | Monthly | School / student group | Decrease absence and participation disparities |
| Implementation | Time allocated to evidence-based core and intervention instruction | Quarterly | School / grade | Document fidelity and adjust promptly |
| In-year progress | Common reading and math diagnostics | 2 to 3 times a year | Grade / subgroup | Positive growth on pre-stated measures |
With three clear, testable hypotheses
- Early literacy. Grade 3 ELA results may reflect variation in foundational literacy, attendance, or access to differentiated reading instruction.
- Upper elementary. Grade 5 disparities may reflect a widening support gap before the transition to middle school.
- Math recovery. Grade 8 improvement may point to transferable teaching practices, cohort mix, or course-placement differences that deserve inspection.
Official documentation and source files
- Official research files: https://caaspp-elpac.ets.org/caaspp/ResearchFileListSB?lstTestYear=2026
- Input ZIPs:
sb_ca{2019,2022,2023,2024,2025,2026}_all_43_69591_csv_*.zip, the corresponding all_43_csv and all_csv files, and the StudentGroups ZIP files. The 2019 files are comma-delimited; later district and county datasets are caret-delimited. - Accompanying audit data file:
MVWSD_CAASPP_Grade_Subgroup_Comparisons_2019_2026.csv, which holds grade by selected subgroup by geography values for both endpoints, comparisons, N and descriptive direction.
Scope
- Assessments: CAASPP Smarter Balanced ELA (Test ID 1) and Mathematics (Test ID 2), Grades 3 to 8. Science (CAST) not included.
- Years analyzed: 2018-19 (test year 2019), and 2021-22 to 2025-26 (test years 2022 to 2026). No 2019-20 testing; 2020-21 omitted because it was disrupted and not uploaded.
- Geographies: MVWSD (county code 43, district code 69591, school code 0000000), Santa Clara County aggregate (43/00000/0000000), and California (00/00000/0000000).
- Key fields: Mean Scale Score; Total Students Tested with Scores (or historical equivalent). Student Group ID crosswalk from the StudentGroups files.
The headline MVWSD, county and state figures behind this post, with their sources, are also on MVWSD Facts: Students.